This post was originally published on the Calyptia blog. Calyptia is the primary sponsor and creator of the Fluent Bit project.
In software development, observability allows us to understand a system from the outside by asking questions about the system without knowing its inner workings. Furthermore, it allows us to troubleshoot quickly and helps answer the question, “Why is this happening?”
To be able to ask those questions to a system, the application must be instrumented. That is, the application code must emit signals such as traces, metrics, and logs. In this post, we will focus specifically on traces.
Distributed tracing involves tracking the flow of requests through a distributed system and collecting telemetry data such as traces and spans to monitor the system’s performance and behaviour. Distributed tracing helps identify performance bottlenecks, optimize resource utilization, and troubleshoot issues in distributed systems.
There are many platforms that are used to monitor and analyze trace data and help engineers spot problems, including Chronosphere, Datadog, and the open source Jaeger. Today, though, we will be using AWS X-Ray, a less commonly used platform but a convenient one for demonstration purposes since so many developers have AWS accounts.
To collect and route the traces to X-Ray we’ll be using Fluent Bit, a widely used open-source data collection agent, processor, and forwarder. Fluent Bit is most commonly used for logging, but it is also capable of handling traces and metrics, making it an ideal single-agent choice for any type of telemetry data.
In this post, we’ll guide you through the process of sending distributed traces to AWS X-Ray using Fluent Bit.
Prerequisites
- Docker and Docker Compose: Installed on your local machine.
- An AWS account
- AWS CLI is a tool to manage AWS services. Install the AWS CLI by following the official AWS CLI installation guide. After installation, configure the AWS CLI with your credentials and default region by running AWS configure. For detailed instructions, refer to the AWS CLI configuration guide
- Familiarity with Fluent Bit concepts such as inputs, outputs, parsers, and filters. If you’re not familiar with these concepts, please refer to the official documentation.
Distributed tracing workflow
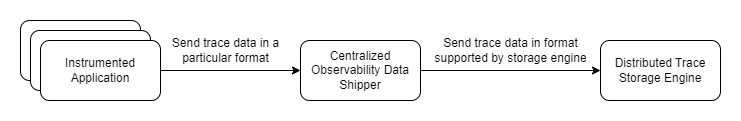 <caption)Instrumented applications emit trace data that is collected and processed by a
centralized agent, when then sends to data to a backend for storage and analysis
<caption)Instrumented applications emit trace data that is collected and processed by a
centralized agent, when then sends to data to a backend for storage and analysis
Generating trace data
In a microservices architecture, applications are instrumented using specific libraries to send trace data in a particular format supported by the storage engine.
OpenTelemetry (OTel) has become the standard format for working with telemetry data. Its open-source observability framework provides a standardized way to collect and transmit telemetry data such as traces, logs, and metrics from applications.OTel provides a common set of APIs, libraries, and tools for collecting and analyzing telemetry data in distributed systems.
We will be using a Python (uses Flask framework) application that we’ve instrumented using OpenTelemetry SDKs to generate trace data in OpenTelemetry protocol (OTLP).
We will configure Fluent Bit to receive the emitted trace data using the OpenTelemetry input plugin.
Note: For simplicity and demonstration purposes, we will be using a single service capable of generating a hierarchical distributed trace. But in a practical scenario, there would be multiple services instrumented to generate trace data.
Storing trace data in AWS X-Ray
AWS X-Ray accepts trace requests in the form of segment documents, which can be sent using two primary protocols:
- AWS X-Ray API (HTTP): You can send segment documents directly to the AWS X-Ray API using the PutTraceSegments API. This is done using HTTP/1.1.
- Direct UDP: You can send segment documents directly to the AWS X-Ray daemon (runs aside with application) over UDP. The X-Ray daemon buffers segments in a queue and uploads them to X-Ray in batches.
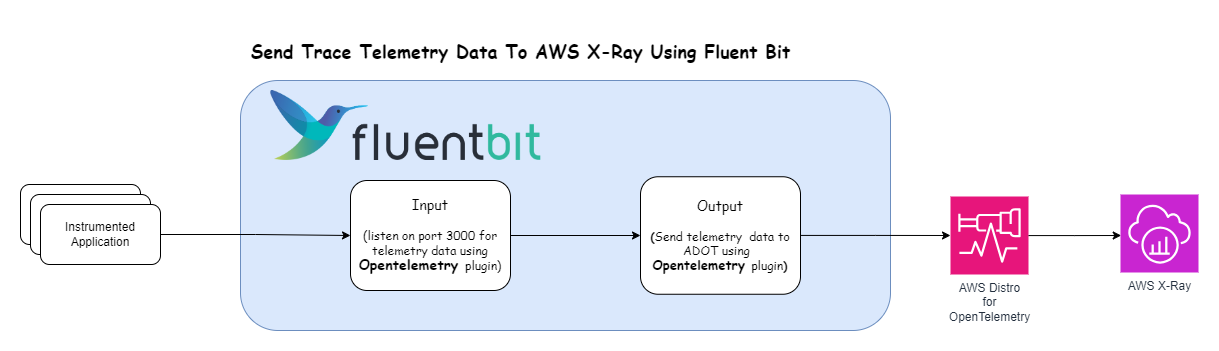
Unfortunately, AWS X-Ray utilizes a non-standards-compliant trace ID. Since Fluent Bit does not support the custom X-Ray API format, it cannot send trace data directly to AWS X-Ray. To overcome this, we will be using the AWS Distro for OpenTelemetry (ADOT), which supports OTLP input and can be used with the Fluent Bit OpenTelemetry output plugin. ADOT automatically converts the compliant trace ID to the format required by AWS X-Ray.
Our architecture looks like this:
Configuring Fluent Bit
Here’s the Fluent Bit configuration that enables the depicted above:
|
|
Breaking down the configuration above, we define one input section:
INPUT section
name opentelemetry: Specifies the input plugin to use, which in this case isopentelemetry. This plugin is designed to receive telemetry data (metrics, logs, and traces) following the OpenTelemetry format.host 0.0.0.0: This binds the input listener to all available IP addresses on the machine, making it accessible from other machines.port 3000: Defines the port on which Fluent Bit will listen for incoming data.successful_response_code 200: This is the HTTP response code that Fluent Bit will send back to the sender to indicate that the data was received successfully. A value of200corresponds to HTTP OK, meaning the request has succeeded.
OUTPUT section
Name opentelemetry: Specifies the output plugin to use. This indicates Fluent Bit will forward the processed data to another service or tool supporting OpenTelemetry data.Match *: This pattern matches all incoming data. In Fluent Bit, theMatchdirective is used to filter which data is sent to a particular output based on the tag associated with the data. The asterisk*\**is a wildcard that matches all tags.Host aws-adot: Specifies the destination host to which the data will be forwarded.Port 4318: Defines the port on the destination host where the OpenTelemetry collector or service is listening.traces_uri /v1/traces: Sets the specific URI endpoint where trace data should be sent. This is part of the OpenTelemetry specification for sending trace data.tls off: Indicates that TLS (Transport Layer Security) will not be used for this connection, meaning data will be sent in plaintext.add_label app fluent-bit: This adds a label to the data being sent out. Labels are key-value pairs. Here,appis the key, andfluent-bitis the value.
With the prerequisites now elucidated, let’s implement it in practice.
Create Fluent Bit configuration file
Create a file called fluent-bit.conf with the following contents:
|
|
Create OTEL Configuration
Create a file called otel.yaml with the following contents and replace the key
<put-your-aws-region> with your AWS region.
|
|
This configuration defines how the AWS Distro for OpenTelemetry (ADOT) Collector operates. It specifies the collection (receivers) of telemetry data via OpenTelemetry Protocol (OTLP) over gRPC and HTTP, and the export (exporters) of trace data to AWS X-Ray:
-
Receivers: Configures the ADOT Collector to receive telemetry data.
-
OTLP Receiver: Accepts data over two protocols:
- gRPC: Listens on
0.0.0.0:4317for incoming gRPC connections. - HTTP: Listens on
0.0.0.0:4318for incoming HTTP connections.
- gRPC: Listens on
-
-
Exporters: Defines how and where processed data is sent.
- AWS X-Ray Exporter: Configured to send trace data to the AWS X-Ray service in the specified AWS region.
-
Service:
-
Pipelines: Organizes the flow of data from receivers to exporters.
- Traces Pipeline: Specific for trace data, it uses the
otlpreceiver to collect data and theawsxrayexporter to send the data to AWS X-Ray.
- Traces Pipeline: Specific for trace data, it uses the
-
This configuration sets up the ADOT Collector to collect telemetry data using OTLP over both gRPC and HTTP and to export trace data to AWS X-Ray for analysis and visualization.
Create Docker Compose Configuration
Create a file called docker-compose.yml with the following contents and replace
these two keys <put-your-aws-access-keys-id> and <put-your-aws-secret-access-key>
with your AWS credentials.
|
|
This docker-compose.yml file defines a multi-container setup with three services: aws-adot, fluent-bit, and trace-generator.
-
aws-adot:
- Uses the
public.ecr.aws/aws-observability/aws-otel-collector:latestimage. - Exposes ports
4317(gRPC),4318(HTTP). - Mounts a local
otel.yamlconfiguration file into the container. - Configures AWS credentials and region through environment variables.
- Specifies a command to use the mounted config file
- Uses the
-
fluent-bit:
- Based on the
cr.fluentbit.io/fluent/fluent-bit:2.2image. - Exposes port
3000for log processing. - Mounts a local
fluent-bit.confconfiguration file into the container.
- Based on the
-
trace-generator:
- Uses the
sharadregoti/trace-generator:v0.1.0image. - Exposes port
5000. - Uses an environment variable to specify the
fluent-bitservice as the destination for trace data.
- Uses the
Start Docker Containers
Execute the below command to start all docker containers:
|
|
Generate Traces by Hitting the Sample App
Open a new terminal and execute the below curl request to generate a trace:
|
|
Go to the AWS Console and Open AWS X-Ray
You will observe a new trace is generated as shown in the below image.
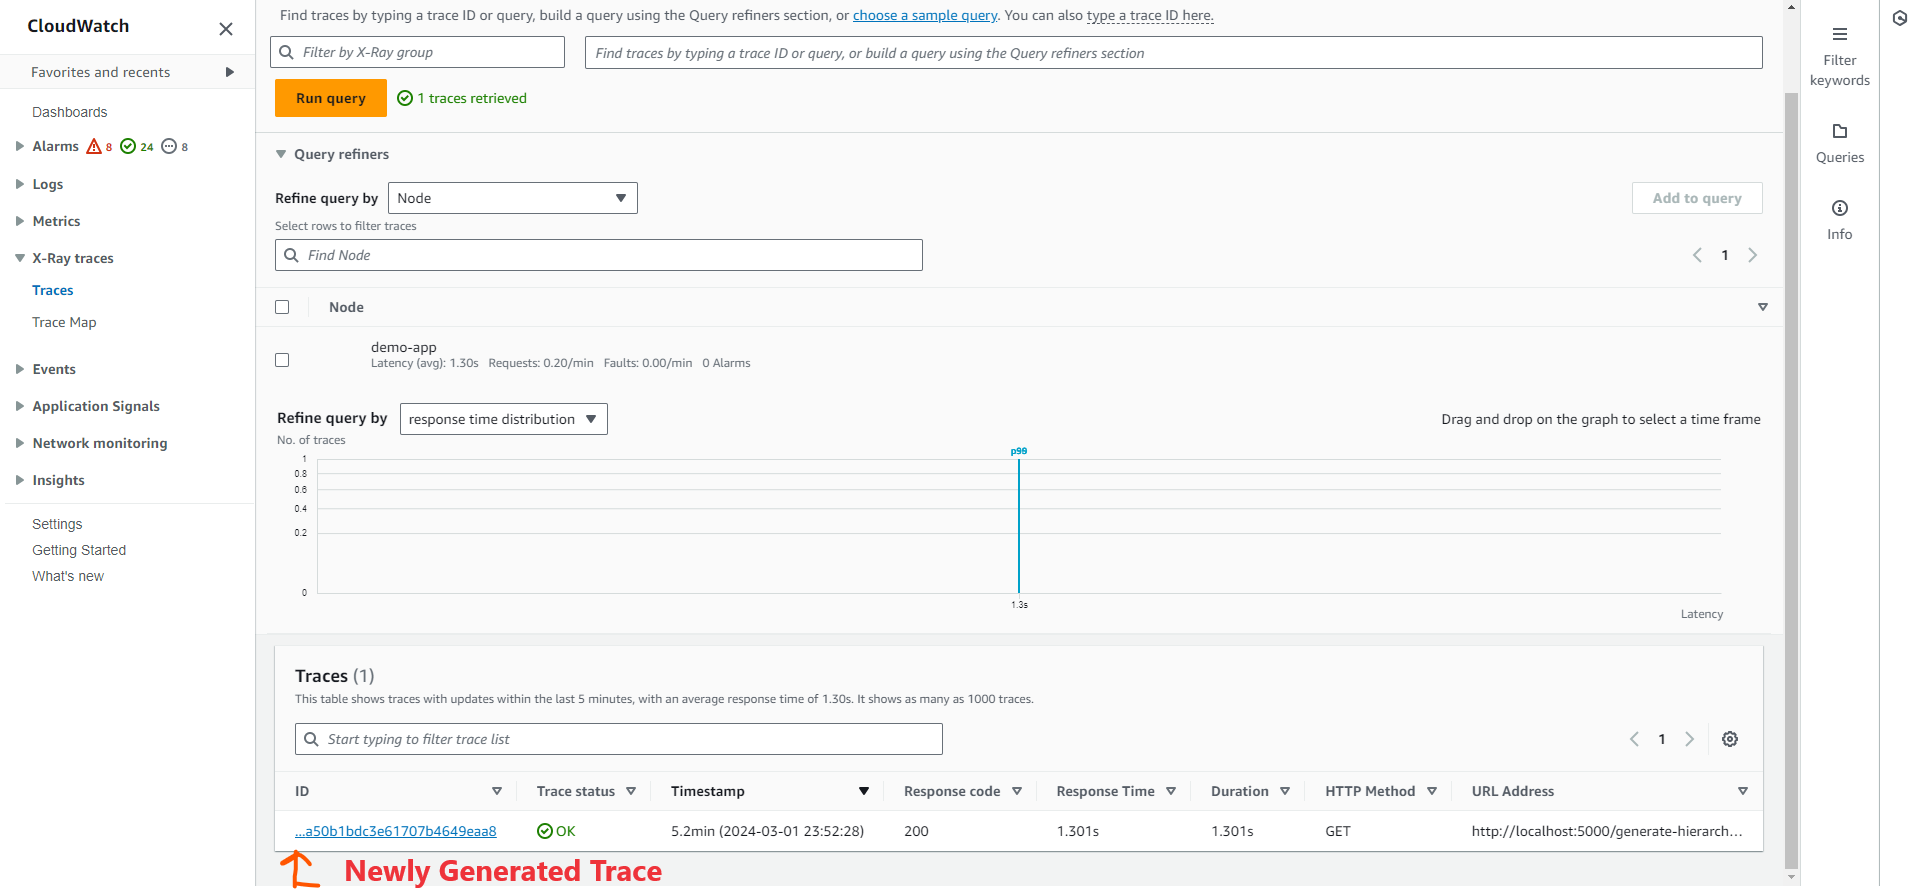
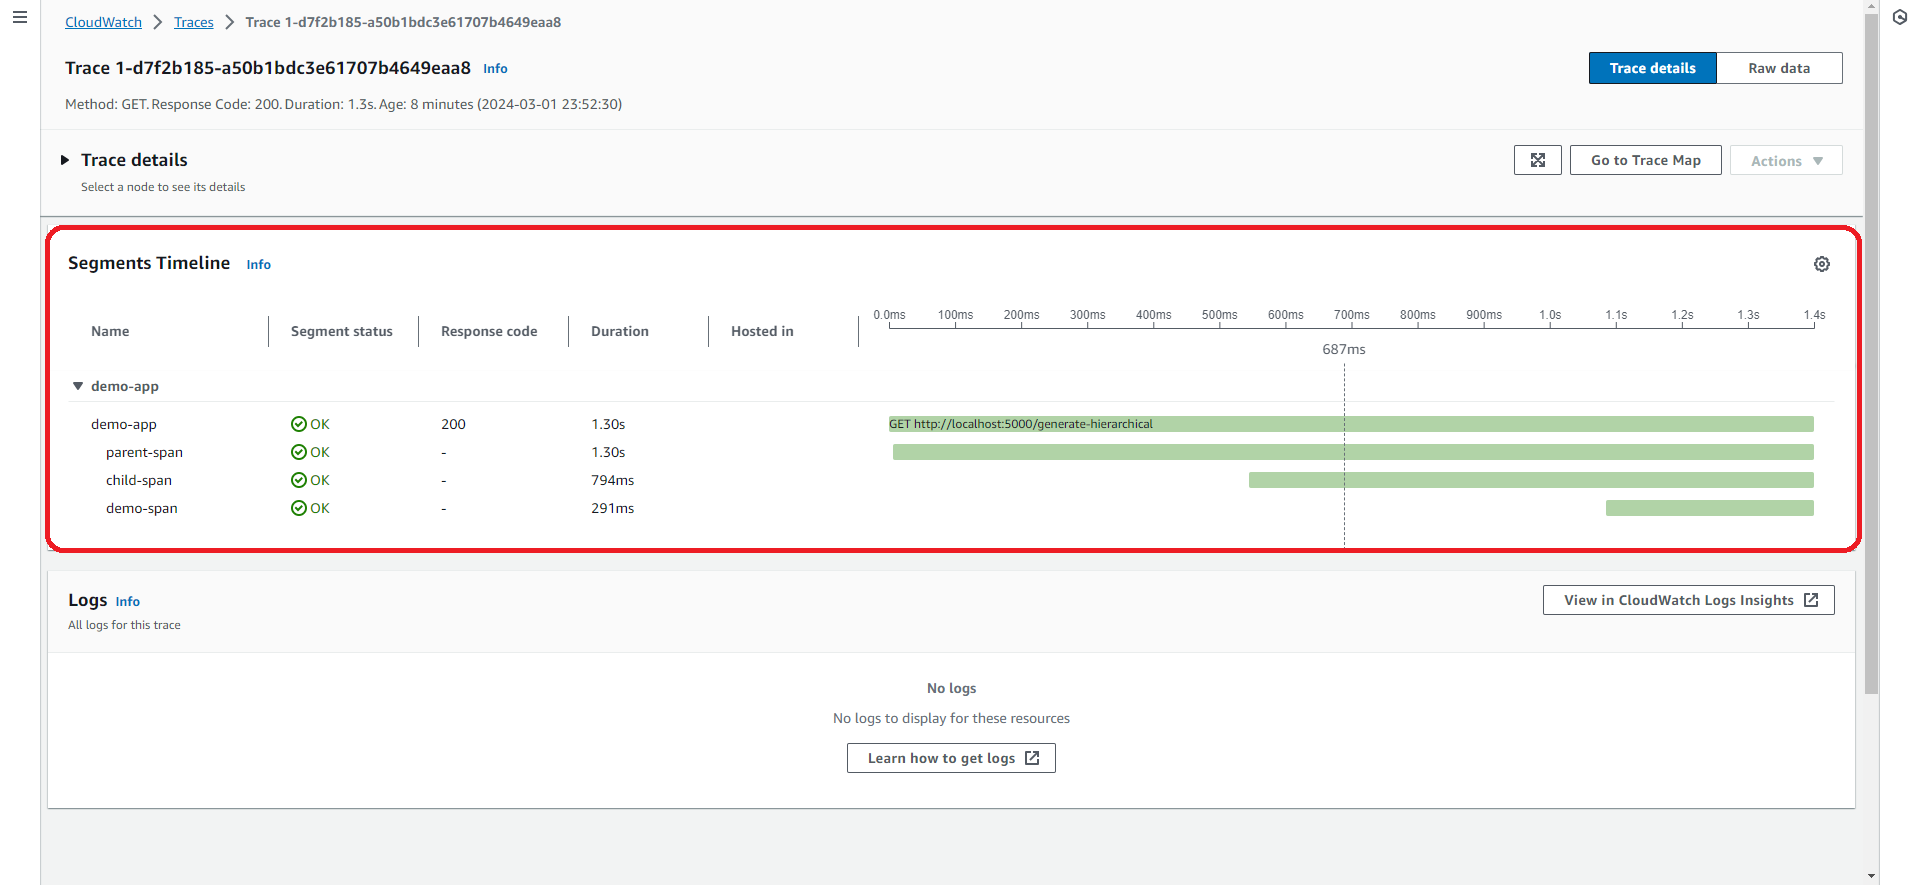
Click on the newly created trace to view the detailed information about the request.
Clean Up
|
|
Conclusion
In this post, we’ve walked through the essentials of setting up distributed tracing with AWS X-Ray and Fluent Bit, demonstrating how to seamlessly integrate trace data collection and forwarding in a microservices environment. By leveraging Docker, AWS X-Ray, and Fluent Bit, developers can achieve a robust observability framework that is both scalable and easy to implement.
Learn more
To learn more about Fluent Bit, visit the project website or the recently launched Fluent Bit Academy where you will find hours of on-demand training videos covering best practices and how-to’s on advanced processing, routing, and all things Fluent Bit. Here’s a sample of what you can find there:
- Fluent Bit for Windows
- Getting Started with Fluent Bit and OpenSearch
- Getting Started with Fluent Bit and OpenTelemetry
We also invite you to join the vibrant Fluent community. Visit the project’s GitHub repository to learn how to become a contributor. Or join the Fluent Slack where you will find thousands of fellow Fluent Bit and Fluentd users helping one another with issues and discussing the projects’ roadmaps.